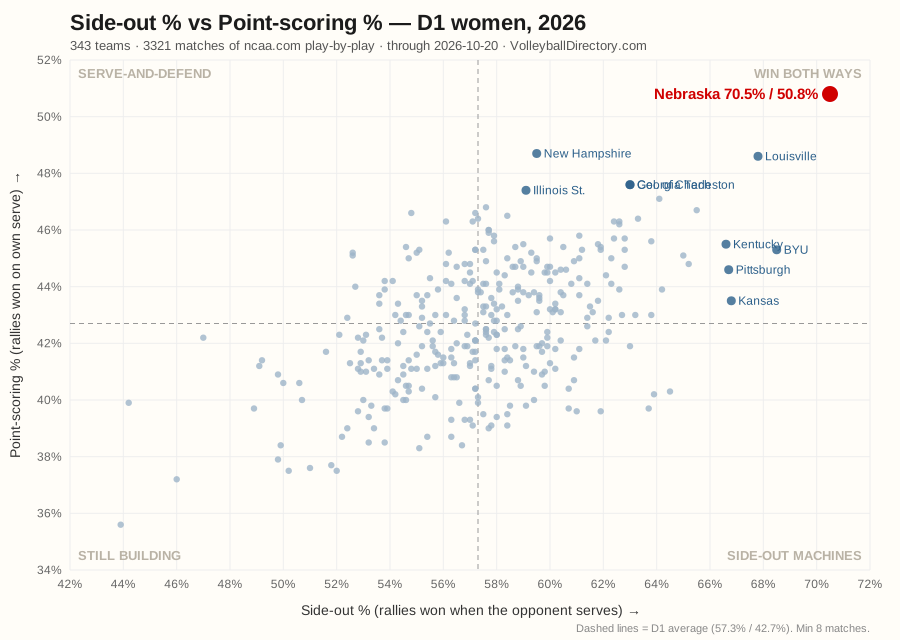
Volleyball is two games stacked on top of each other. When the other team serves, you have to side out and take the serve back. When you serve, you’re trying to score a point with the other team holding the advantage. Win more of both than everybody else and you look a lot like the 2026 Huskers.
Through games Tuesday, October 20, 2026: Nebraska sides out 70.5% of the time (#1 of 343 in D1) and wins 50.8% of its own serves (#1).
Top-right = wins rallies both ways. Dashed lines are the D1 average. Chart by Volleyball Directory from ncaa.com play-by-play.
The two numbers, in plain English
Side-out % = rallies you win when the other team serves ÷ rallies where they served. The D1 average is about 57%. Receiving is the easier job, because your team gets the first swing.
Point-scoring % = rallies you win on your own serve ÷ rallies where you served. The D1 average is about 43%. Scoring on serve is the hard part. You have to dig the other team’s first swing and then put the ball away yourself.
Why fans should care
Side-out keeps you alive. A team at 70% almost never hands over a long run. That steadiness is why some teams never look rattled.
Point-scoring wins sets. Two teams that both side out 65% are stuck trading points until someone gets a stop. Every point scored on serve is a stop, and stops are how 25-23 becomes 25-18.
Being elite at both is rare. Most good teams lean one way. When one dot sits alone up and to the right, you’re looking at a really special team.
Top 25: Side-out %
#
Team
Conf
Matches
Side-out %
Point-scoring %
1
Nebraska
Big Ten
19
70.5%
50.8%
2
BYU
Big 12
16
68.5%
45.3%
3
Louisville
ACC
20
67.8%
48.6%
4
Kansas
Big 12
17
66.8%
43.5%
5
Pittsburgh
ACC
18
66.7%
44.6%
6
Kentucky
SEC
18
66.6%
45.5%
7
Tennessee
SEC
17
65.5%
46.7%
8
Florida
SEC
17
65.2%
44.8%
9
Vanderbilt
SEC
17
65.0%
45.1%
10
SMU
ACC
18
64.5%
40.3%
11
Georgia
SEC
17
64.2%
43.9%
12
Hawaii
Mountain West
19
64.1%
47.1%
13
Wisconsin
Big Ten
18
63.9%
40.2%
14
Arizona St.
Big 12
18
63.8%
45.6%
15
East Carolina
American
20
63.8%
43.0%
16
Baylor
Big 12
17
63.7%
39.7%
17
Colorado St.
Pac 12
17
63.3%
46.4%
18
Texas A&M
SEC
19
63.2%
43.0%
19
Georgia Tech
ACC
18
63.0%
47.6%
20
Col. of Charleston
Caa
21
63.0%
47.6%
21
California
ACC
19
63.0%
41.9%
22
Utah Tech
Big Sky
18
62.8%
45.7%
23
Washington
Big Ten
17
62.8%
45.3%
24
North Carolina
ACC
16
62.8%
44.7%
25
Purdue
Big Ten
17
62.7%
43.0%
Top 25: Point-scoring %
#
Team
Conf
Matches
Side-out %
Point-scoring %
1
Nebraska
Big Ten
19
70.5%
50.8%
2
New Hampshire
America East
19
59.5%
48.7%
3
Louisville
ACC
20
67.8%
48.6%
4
Georgia Tech
ACC
18
63.0%
47.6%
5
Col. of Charleston
Caa
21
63.0%
47.6%
6
Illinois St.
Mvc
19
59.1%
47.4%
7
Hawaii
Mountain West
19
64.1%
47.1%
8
San Diego
Wcc
17
57.6%
46.8%
9
Tennessee
SEC
17
65.5%
46.7%
10
Florida A&M
Swac
21
54.8%
46.6%
11
UT Martin
Ovc
19
57.2%
46.6%
12
St. John’s (NY)
Big East
21
58.4%
46.5%
13
Colorado St.
Pac 12
17
63.3%
46.4%
14
Harvard
Ivy League
16
57.3%
46.4%
15
Delaware St.
Meac
21
56.1%
46.3%
16
UNI
Mvc
19
62.6%
46.3%
17
Michigan St.
Big Ten
18
62.4%
46.3%
18
Mercer
Socon
21
57.1%
46.3%
19
Minnesota
Big Ten
16
62.6%
46.2%
20
Coppin St.
Meac
23
57.7%
46.0%
21
LIU
Nec
17
57.7%
46.0%
22
Alabama
SEC
17
57.7%
45.9%
23
High Point
Big South
18
61.1%
45.8%
24
St. Thomas (MN)
Summit League
16
57.9%
45.8%
25
Marquette
Big East
18
60.0%
45.7%
Big Ten (sorted by side-out % + point-scoring %)
#
Team
Conf
Matches
Side-out %
Point-scoring %
1
Nebraska
Big Ten
19
70.5%
50.8%
2
Minnesota
Big Ten
16
62.6%
46.2%
3
Michigan St.
Big Ten
18
62.4%
46.3%
4
Washington
Big Ten
17
62.8%
45.3%
5
Illinois
Big Ten
19
62.6%
43.9%
6
Penn State
Big Ten
18
61.2%
45.3%
7
Purdue
Big Ten
17
62.7%
43.0%
8
Michigan
Big Ten
19
61.1%
43.7%
9
Oregon
Big Ten
18
60.5%
43.7%
10
UCLA
Big Ten
19
62.1%
42.1%
11
Wisconsin
Big Ten
18
63.9%
40.2%
12
Indiana
Big Ten
17
60.2%
43.2%
13
Iowa
Big Ten
22
60.4%
42.1%
14
Maryland
Big Ten
19
59.9%
42.2%
15
Rutgers
Big Ten
20
59.0%
41.5%
16
Ohio St.
Big Ten
18
59.1%
41.2%
17
USC
Big Ten
18
59.1%
39.8%
18
Northwestern
Big Ten
19
57.2%
40.4%
How we computed it
Source: official ncaa.com play-by-play for every D1 women’s match listed on the ncaa.com scoreboard from Aug. 20 through Tuesday, October 20, 2026. That’s 3,321 matches and about 259,863 rallies. Volleyball Directory calculated every number here. None of it is copied from another account.
Who served: the team that wins a rally serves the next one. When a set’s first server isn’t shown, we work it out from a first-rally ace or service error, or from teams alternating first serve in sets 1–4. Rallies we still can’t pin down are left out (9,868 total, about 3.8%). That includes the rally after any gap in the official feed. As a check, 88,842 of 89,477 aces and service errors (99.3%) line up with the server we worked out.
Who’s included: D1 teams with at least 8 matches (343 teams). Rallies against non-D1 opponents count toward the D1 team’s numbers.
Not adjusted for schedule strength. A 70% side-out rate against the Big Ten and the same rate against a lighter schedule show up as the same number.